Latency numbers
From an L1 cache hit to a trans-Atlantic round trip.
Handy metrics based on numbers above:
- Read sequentially from HDD at 30 MB/s
- Read sequentially from 1 Gbps Ethernet at 100 MB/s
- Read sequentially from SSD at 1 GB/s
- Read sequentially from main memory at 4 GB/s
- 6-7 world-wide round trips per second
- 2,000 round trips per second within a data center
Latency numbers visualized#
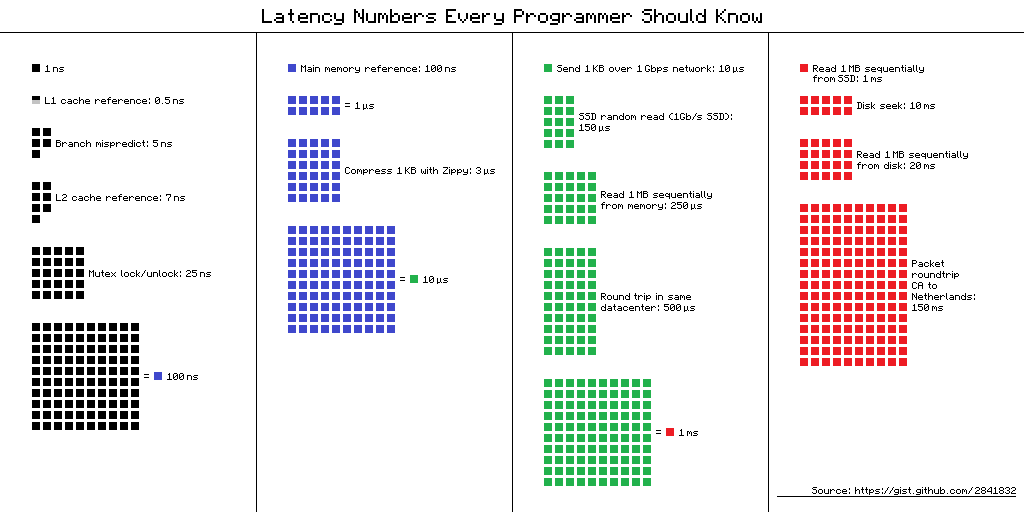
Sources and further reading4 links
Added on this site
How old these numbers are#
This table is the widely shared list from 2012, built on figures Jeff Dean presented in 2009 (see the sources below). Read it for the gaps between rows, not for exact values. A main memory reference is 200 times slower than an L1 cache hit, a round trip within a datacenter costs as much as 5,000 memory references, and a disk seek costs 20 of those round trips. Those orders of magnitude are what an interviewer expects you to know, and they still hold.
Some rows have moved since:
- Storage got much faster. Current NVMe SSDs read sequentially at several gigabytes per second, against the table's 1 GB/s, so reading 1 MB from an SSD now takes a few hundred microseconds rather than a millisecond. Random reads are faster too.
- Memory bandwidth grew. Reading 1 MB sequentially from memory is several times quicker than the 250 µs shown.
- The CPU-level rows barely changed. Clock speeds stopped rising around the time the table was written, so cache references and branch mispredictions cost about the same.
- Spinning disks did not change. A hard disk seek still takes around 10 ms, which is why they are now used for bulk and archive storage rather than for databases that serve requests.
When you use these numbers in an estimate, say that they are rough, and round them to the nearest power of ten. That is accurate enough to choose between designs.